- Greenhouse gas (GHG) emission trends
- Mitigation in the short and medium term across different economic sectors (until 2030)
- Mitigation in the long term (beyond 2030)
- Policies, measures and instruments to mitigate climate change
- Sustainable development and climate change mitigation
- Gaps in knowledge
If you don’t fancy ploughing through the report and it’s plethora of data and charts, I’ll pull out some highlights over a few blogs. In this one I’ll look at historical trends.
Greenhouse Gas emission trends
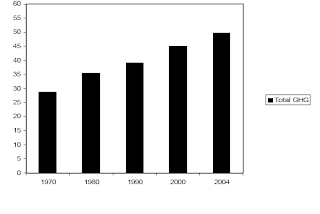
The report starts by looking at greenhouse gas (GHG) emission trends. It notes that between 1970 and 2004 emissions of the main GHGs - CO2, CH4, N2o, HFCs, PFCs and SF6 – have increased by 70% (24% between 1990 and 2004).
The largest growth areas between 1970 and 2004 are the energy supply sector (up 145%) and transport (up 120%). Other areas of note are industry (up 65%), land use, land use change and forestry (up 40%) and agriculture (up 27%).
In 2004, Developed countries produced 57% of world GHG emissions versus 20% of world population.
The long term trend of declining carbon intensity of energy supply reversed after 2000. This means that more carbon is being produced per Watt of energy – and we’re producing a lot more
A range of policies, including those on climate change, energy security, and sustainable development, have been effective in reducing GHG emissions in different sectors and many countries. The scale of such measures, however, has not yet been large enough to counteract the global growth in emissions.
Below is a summary graph of total GHG emissions in Gigatonnes CO2 equivalent from 1970 to 2004.
You can click on the graph to open it in a new window.
No comments:
Post a Comment